
Technology To Track The Spread Of COVID-19
By Wu Min, Nebula Graph

Practically the entire world is focused on stopping the spread of COVID-19. Many methods have come to mind for doing so. One is contact tracing. Though a bit controversial, there are technologies that can be used for this application. One such promising technology is to use a graph database. And it has already been proven in a real case.
There was a case in China where a graph database was used. To protect identities, details about the actual people and locations will not be revealed here. There were five confirmed cases of COVID-19 in a shopping mall. In the first three cases, it seemed there was no epidemiological correlation.
Most experts agree that COVID-19 is usually transmitted person to person, as opposed to from objects to people. So, we can enter these transmission details into a graph database model to start tracking. But first, how does a graph database work?
How A Graph Database Works
The database most people are familiar with is known as a Relational Database Management System (RDBMS). It is commonly known to look like a table of columns and rows. An RDBMS is very limited in large-scale capabilities, such as would be needed to track the spread of a disease nationwide or worldwide. Performance severely degrades as queries get more complex. Enter graph databases that are designed for uncovering big volumes of data.
Graph databases store deep relationship characteristics about data within data itself. Depending on the graph database, a user can manage millions to billions of transactions. This, important for the real scenario we will go over, includes uncovering how each data set relates to other data sets. In other words, with an RDBMS database, the data is just a bunch of rows and columns of information. There are limited ways to correlate how it all relates to each other. Graph databases can correlate this with extensive data modeling. They essentially remove the six degrees of separation within a dataset.
A graph database will have what is called VERTICES or NODES. These are objects or datasets. VERTICES are assigned a TAG. In this case, we might assign the TAG of “infected person” and a second TAG might be “ACME shopping mall” for the location. So, using a TAG, we can create many VERTICES. Next PROPERTIES are defined on TAGS. For example, the “infected person” TAG can be given the PROPERTIES of “name,” “age” and “marital status” and so on.
With VERTICES, TAGS, and PROPERTIES defined, a data scientist can begin to connect the dots with what is known as an EDGE or more than one EDGE. EDGES are used to program in connections to data one way or both ways. We also can create EDGE TYPES. Here, we might have two EDGE TYPES. One might be “infected at the mall,” and the other might be “infected at home.” There is practically no limit to the datasets that can be created and correlated.
A Real Case Tracking COVID-19 With A Graph
Returning to the case of the five people infected in the shopping mall, we can begin to do some database modeling. We might create an EDGE for a person transmitting to another, such as in Demo 1 below. So, let us say that person A infects person B, then person B infects person C, and so on. This data set then creates a tree-like path, such as in Demo 2.
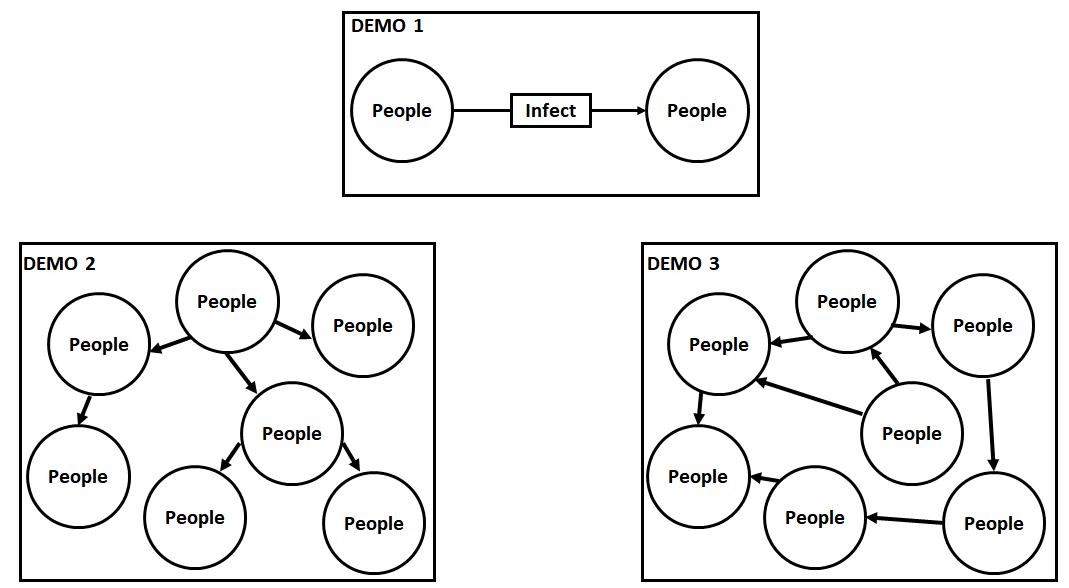
However, COVID-19 transmissions are more complex than this. There are cross-infections to consider. Because of repeated use of public places, transportation, and more, the spread path of the virus is more like a network structure, such as in Demo 3. As a result, a graph database is ideal by nature for storing and exploring transmission relations.
Understanding The Data Sets
For definition purposes of how one might create data sets, a data scientist might create Usr1, Usr2, Usr3, Usr4, and Usr5 to refer to the five cases. Usr1 caught a fever on January 24. They worked in Area A of the shopping mall from January 22 to January 30. They were diagnosed on January 31.
Usr2 is the husband of Usr1. He had symptoms on January 25 and was diagnosed on February 1. Usr3 was in close contact with a suspected case on January 18 and then worked in Area B of the shopping mall. He started feeling a fever on January 24 and was diagnosed on February 1.
Usr4 had contact with suspected cases on January 12 and 13, and then worked in Area C of the shopping mall. He started feeling a fever on January 21 and was diagnosed on February 1. Finally, Usr5 visited the shopping mall noted as Area A, Area B, and Area C from around 4-8 PM on January 23. This person started feeling a fever on January 29 and was diagnosed on February 2.
Graph Model Extraction
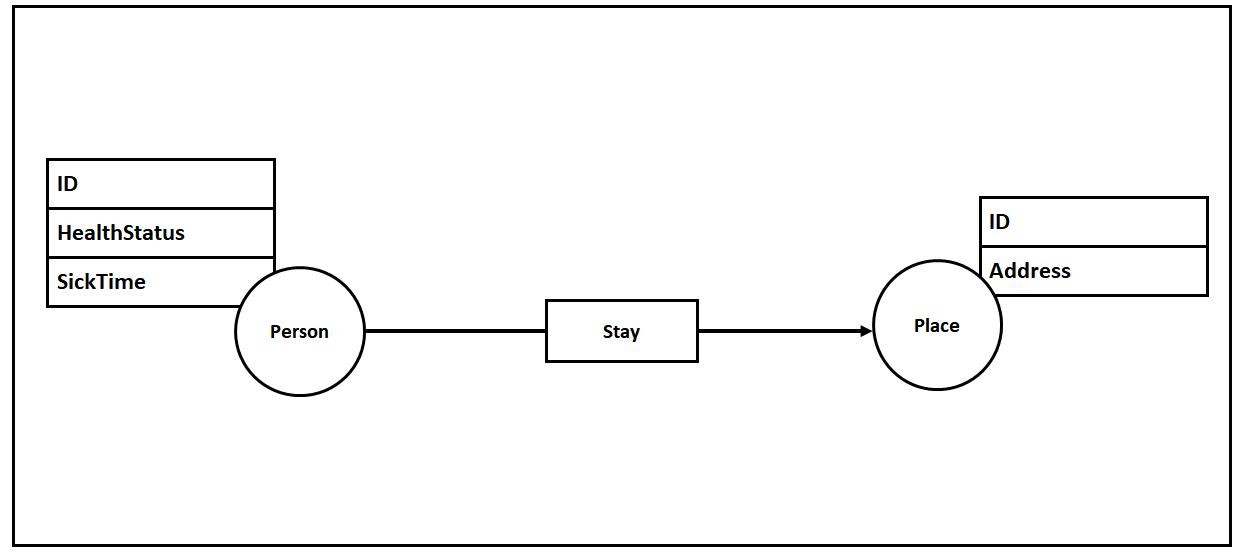
Based on this data, a data scientist might extract a data model with two types of VERTICES, for example PERSON and SPACE, and one EDGE type that might be STAY. The EDGE type identifies the time the person spent at the SPACE. Furthermore, the properties in the PERSON vertex type could include an ID for the person, like their name, and current health status, like sick, fever, healthy, symptom-free, and so on. You might also include the confirmed time for when they were diagnosed.
For the properties in the SPACE tag, you might include something to identify the location, like the address. Finally, for the properties in STAY you might use the time they arrived, and time departed, for example.
Data Importing
Based on this model, and the following figure, a user can import their data. Then with a graph database, they can uncover the sources of the virus. This includes knowing who should be observed or isolated after the diagnosis of a patient.
An example of how such data might be imported is as such, for example for Usr1:
Person: ID 2020020201, HealthStatus: Sick, ConfirmedTime: 20200124;
Stay Time: start_time: 2020-01-23 12:00:00, end_time: 2020-01-23 18:00:00;
Place: Shopping mall Area A
Stay Time: start_time: 2020-01-23 18:00:00, end_time: 2020-01-24 8:00:00;
Place: Community A in XYZ District
With this data imported into a graph database, a data analyst can start to build relationships between persons, places, and time. If we dive into Usr1 as an example, we can start to reveal important information. So, first we find out where Usr1 was on January 23. Next, we check if Usr1 was exposed to any confirmed cases. In a graph database, an example of this specific query using a programming language might be as follows.

We might see there is an oddity in that at the time of Usr1’s onset (2020-01-24), there was no fever reported with the people that person contacted. Could it be that these people were in contact with other patients, thus they were carriers instead of symptomatic? To figure this out, we might need to build a relationship in the data to see those who had indirect connections with each other.
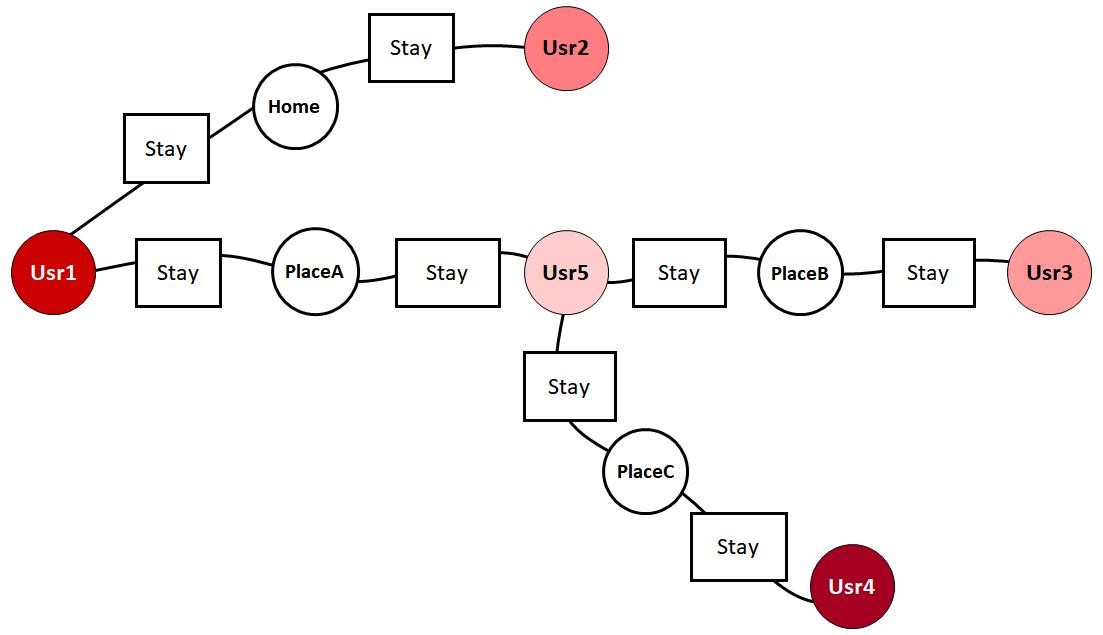
When we build this query, we can reveal that Usr1 had a connection with Usr2 and Usr5 between 12:00 on January 23 and 8:00 on January 24. But Usr2 and Usr5 were reportedly healthy at that time. However, we can uncover here that Usr5 was in previous contact with Usr4, who was a patient with a reported fever.
So, we have uncovered one spread path. Usr4 became sick on January 21. After being sick, he went to a restaurant in a specific area (11:00-20:00 on January 23). Here he was exposed to Usr5 (11-15 pm on January 23), making Usr5 a carrier during that contact. Then Usr5 headed to Place A, B, and C (16:00-23:00 on January 23). During this time, he transmitted the virus to Usr1 who worked in PlaceA (12:00-18:00 on January 23). And Usr1 became sick on January 24.
Figuring Out Who Needs To Be Isolated
After Usr1 is diagnosed, we need to see where and when she has been and who was in contact with her in the same place during this time. People that were exposed to her need close observation and isolation. We can build a query for this too in a graph database.
After doing so, we can see that Usr1 and Usr2 were in contact with each other in PlaceA, which made Usr2 a suspicious case. With this basis formed, a data scientist is likely to then want to observe a large number of vertices. In this case, it would require tens of millions of potential people and their second and third propagation trajectories. So, they would turn to a program with batch queries for efficiency.
In this real case, the Chinese Spring Festival travel rush, and other causes lead to wide spreading of COVID-19. Across social media, there were restrictions made in communities, villages, and businesses for stringent quarantine. People were asked to report daily whereabouts and health status. The quarantine and tracking of billions of people were heavily burdensome on time and money.
The self-reporting mechanisms used were inefficient and unreliable. In addition, there are always cases where people conceal behavior and medical history. This may lead to a failure in timely isolation and treatment and can impose negative effects on businesses.
But the development of Big Data has enabled the construction of data systems in security, transportation, medical departments, and more that can be integrated for collaboration. This real case example in China is but a tiny one of how Big Data and graph databases can be used to help remedy problems at scales not possible even just a few years ago.
About The Author
Wu Min is the Vice President of Product at Nebula Graph, an open-source distributed graph database. After earning his Ph.D. at Zhejiang University, he worked at Alibaba Cloud and Ant Financial for years. He also has been active in academia.