
Applying Machine Learning To Live Data

By Carol McDonald, industry solutions architect, and Joseph Blue, data scientist, MapR
According to the OECD, U.S. healthcare devotes far more of its economy to health than any other country, yet the life expectancy of the American population is shorter than in other countries that spend less. The biggest areas of spending and concern are for coordination of care and preventing hospital admissions for people with chronic conditions such as heart disease. The combination of connected medical devices, streaming analytics, big data, and machine learning has become more powerful and less expensive than before, which could enable scalable chronic disease management with better care at lower costs.
This article will walk through a streaming machine learning solution to detect anomalies in data from a heart monitor, demonstrating an example of how newer digital connected health technologies could be used. This is an example of an unsupervised machine-learning approach. In this case, we do not start with a known set of heart conditions that we will try to classify. Instead, we look for deviations from a typical reading and we apply that evaluation in near real-time.
What Is Anomaly Detection?
Anomaly detection first establishes what normal behavior is, then compares it to the observed behavior and generates an alert if significant deviations from normal are identified. Cardiologists have defined the waves of a normal EKG pattern shown in the image here (where the x-axis represents time and the y-axis is voltage):
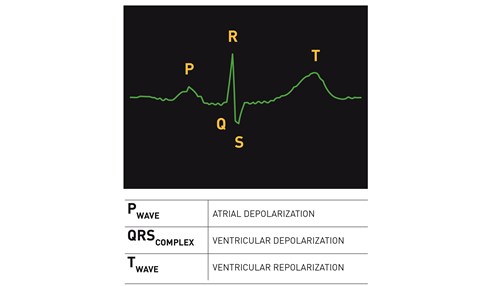
We use this repeating pattern of a typical EKG to train a model on previous heartbeat activity and then compare subsequent observations to this model in order to evaluate anomalous behavior.
Building The Model For Normal
To build a model of typical heartbeats activity, we process an EKG (based on a specific patient or a group of many patients), break it into overlapping pieces that are about 1/3 sec long and then apply a clustering algorithm to group similar shapes. This results in a catalog of shapes, which can be used for reconstructing what an EKG should look like. The size of the window is configurable - if too small, then the patterns won’t be recognizable; if too large, latency of detecting an anomaly will increase.
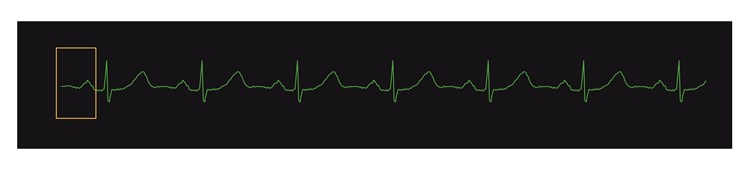
Windowing The EKG
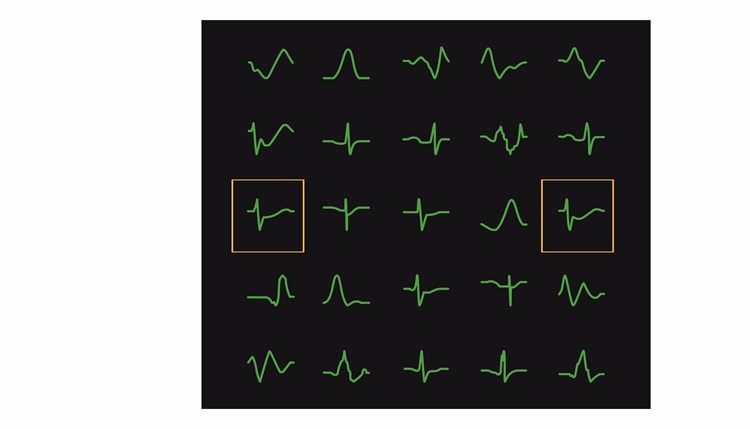
Common Shape Catalog
Comparing Actual Behavior To Normal
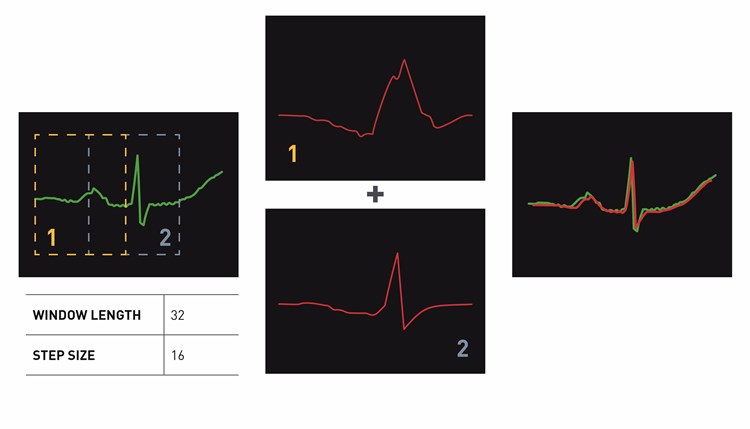
In order to compare the actual EKG to the model for normal behavior, as the signal arrives the overlapping sequence of shapes, shown in green, are matched against the catalog of shapes, shown in red, and then added together to get a real time reconstruction of what the typical EKG should look like (to reconstruct with overlapping pieces, we multiply by a sine-based windowing function).
Diagnosing Anomalies
The difference between the observed and expected EKG (the green minus the red) is the reconstruction error, or residual (shown in yellow). If the residual is high then there could be an anomaly.
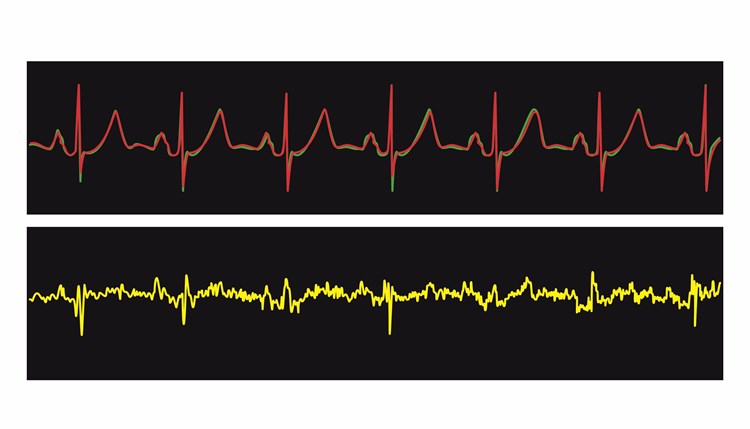
EKG Reconstruction With Corresponding Errors In Yellow (Presented On A Smaller Scale)
Putting It All Together Into An Anomaly Detector
The goal of anomaly detection is to find real problems while keeping false alarms low; the challenge is to know what size reconstruction error should trigger an alert. T-digest is a technique for assessing the size of the reconstruction error as a quantile, based on the distribution of the data set. The algorithm can be added to the anomaly detection workflow so that you can set the number of alarms as a percentage of the total observations. T-digest estimates a distribution very accurately with a modest amount of samples, especially at the tails (which are typically the most interesting parts). And by estimating these accurately, you can set the threshold for generating an alert. For example, setting the threshold at 99% will result in approximately one alert for every reconstruction, which will result in a relatively large number of alerts (anomalies, by definition, should be rare). At 99.9%, an alert would be generated for every one thousand reconstructions.
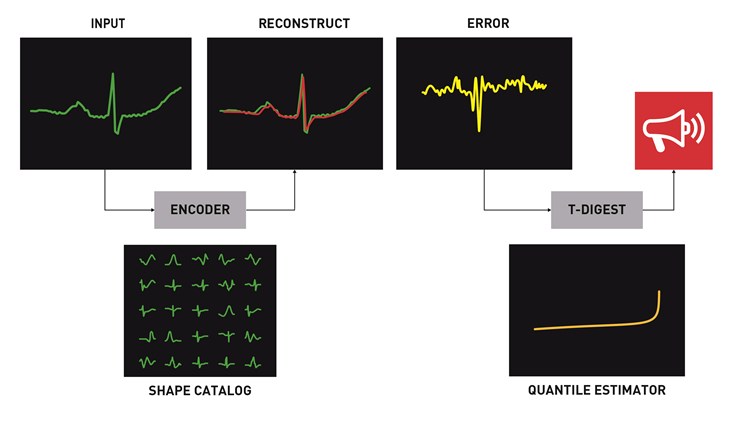
Real-Time Anomaly Detection Workflow Showing Reconstruction And Assessment Of Anomaly
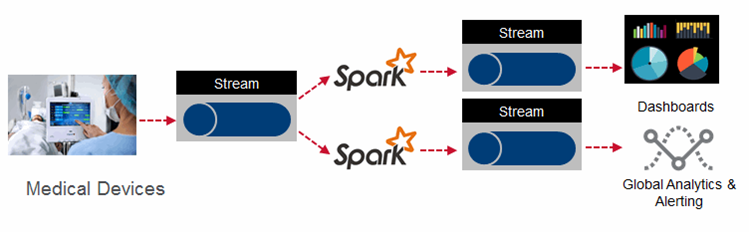
Streaming Architecture For Real-Time Monitoring Of Patients
Providers are looking to administer more proactive care to their patients by constantly monitoring patient vital signs. The data from these various monitors can be analyzed in real time to send alerts to care providers so they know instantly about changes in a patient’s condition. Processing real-time events with machine learning algorithms can provide physicians’ insights to make lifesaving decisions and allow for effective interventions.
References And More Information:
- Practical Machine Learning: A New Look At Anomaly Detection
- Code for t-digest: https://github.com/tdunning/t-digest
- EKG anomaly detection example: https://github.com/tdunning/anomaly-detection
- Code for streaming application with EKG anomaly detection: https://github.com/caroljmcdonald/sparkml-streaming-ekg
About The Authors:
Carol McDonald is an industry solutions architect at MapR. Carol has extensive experience as a developer and architect building complex, mission-critical applications in the Banking, Health and Telecom industries. As a Technology Evangelist at Sun Microsystems, Carol traveled all over the world speaking at Sun Tech Days. Carol holds a M.S. in Computer Science from the University of Tennessee, a B.S. in Geology from Vanderbilt University. Carol is also Fluent in French and German.
Joseph Blue is a data scientist at MapR. Previously, Joe developed predictive models in healthcare for Optum (a division of UnitedHealth) as chief scientist and was the first fellow for Optum’s startup, Optum Labs. Before his time at Optum, Joe accumulated 10 years of analytics experience at LexisNexis, HNC Software, and ID Analytics (now LifeLock), specializing in business problems such as fraud and anomaly detection. He is listed on several patents.